Toronto is the largest city in Canada with its approximately 3 million inhabitants. The city is a world leader when it comes to finance, technology, business, entertainment and culture. Toronto is home to more than 80 ethnic groups with more than 100 languages, which has also made it one of the most multicultural cities in the entire world.
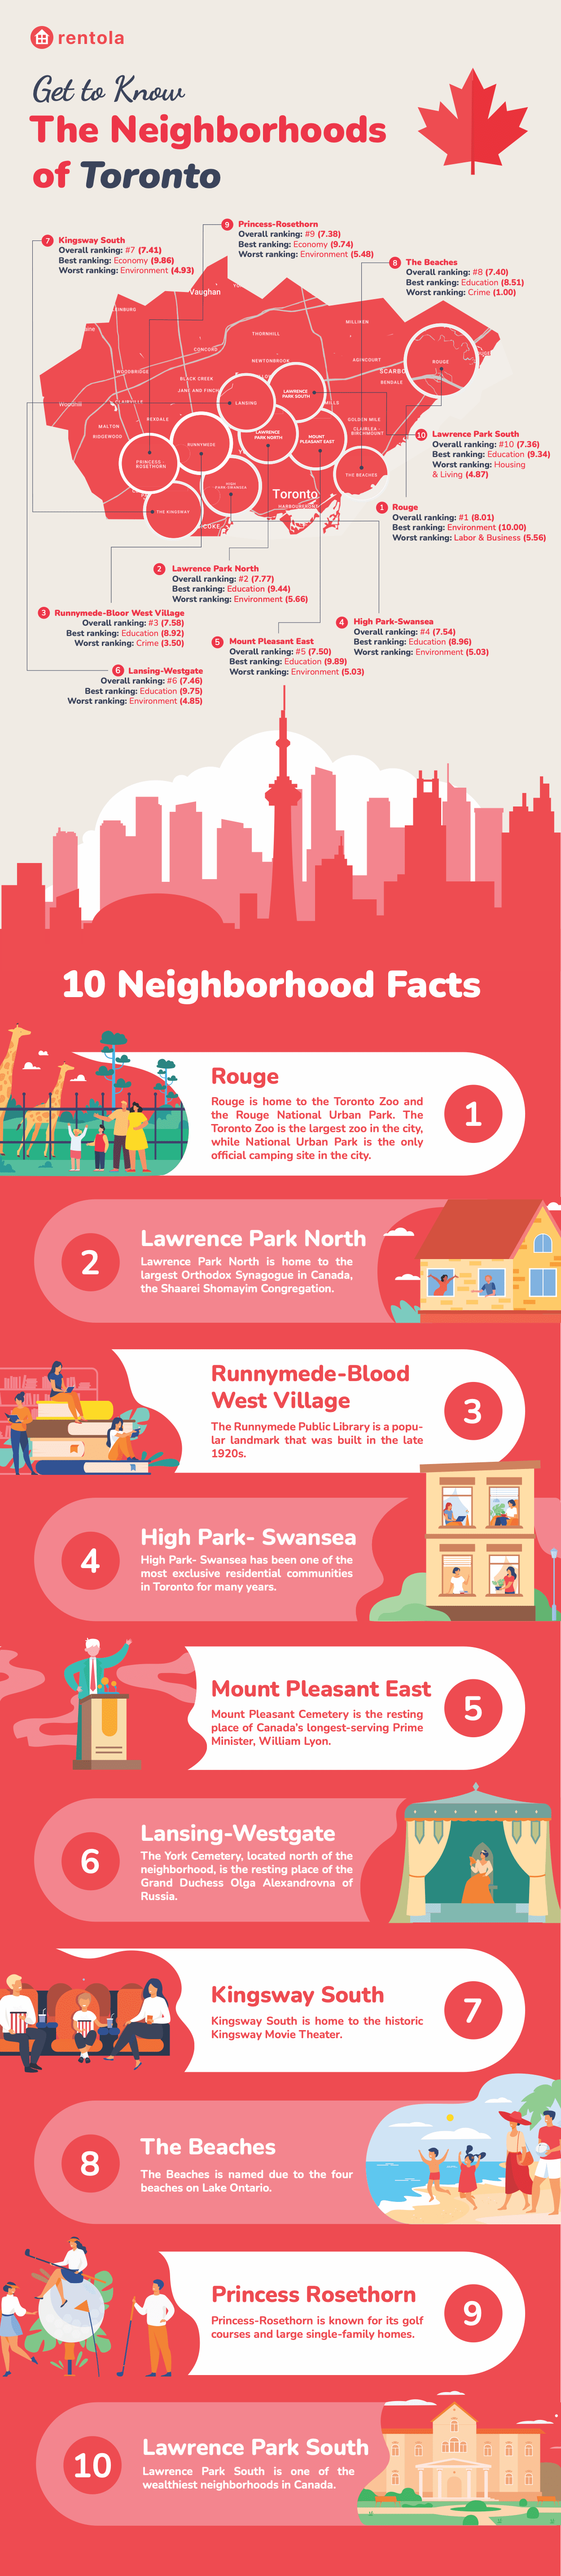
At rentola, we have carried out a study which aims to delve deeper into the progressive metropolis and determine which neighborhoods in the city are the best and which are the worst.
The study has resulted in the development of a quality index and ranking of the 140 neighborhoods of Toronto, based on 7 categories that indicate different aspects of quality of life. The selected categories and rankings aim to give a local overview of the quality of the neighborhoods in Toronto in terms of crime, environment, education, housing & living, labor & business, economy and health. Our Quality Index has ranked all 140 neighborhoods based on the 7 separate quality factors, some of which include even more indicators, to ensure the highest possible data quality. You can see how each of the 140 neighborhoods ranked for each category in the table below.
-
 Crime
Crime
-
 Environment
-
 Education
-
 Housing
-
 Labor & Work
-
 Economy
-
 Health
Methodology
All data has been collected and processed from several national statistics databases like, Statcan, Open Data Toronto and OCHPP (Ontario Community Health Profiles Partnership). The latest data available has been used for each datasource. Min-max normalization has been used to index the data sources in question. This method of indexing allows us to convert any kind of data to a value between 1-10, where 1 represents the lowest / worst value and 10 the highest / best value within the categories in question. This means that the higher a score an area achieves, the better it is relative to the others. To ensure the most precise and representative result as possible, all departements missing more than two data sources have been removed from the Quality Index.
-
Crime
Looks at the total major crime incidents, thefts, sexual assaults and assaults
Open Data Toronto -
Environment
Compares the green rebate programs, green spaces and pollutants released to air
Open Data Toronto -
Education
The catholic school graduation rate, percentage of population with less than a highschool education and percentage of catholic school literac
Open Data Toronto & Statcan -
Housing
Compares the home prices and the population density
Open Data Toronto & Statcan -
Labor & Work
Looks at the unemployment rate and number of businesses
Open Data Toronto & Statcan -
Economy
Focuses on the debt risk score, percentage of households earning more than 90K a month and percentage of households earning less than 35K a month
Open Data Toronto & OCHPP (Ontario Community Health Profiles Partnership) -
Health
Compares the prevalence of diabetes, asthma, high blood pressure, mental health and addiction-related visits and chronic obstructive pulmonary disease
OCHPP (Ontario Community Health Profiles Partnership)